
|
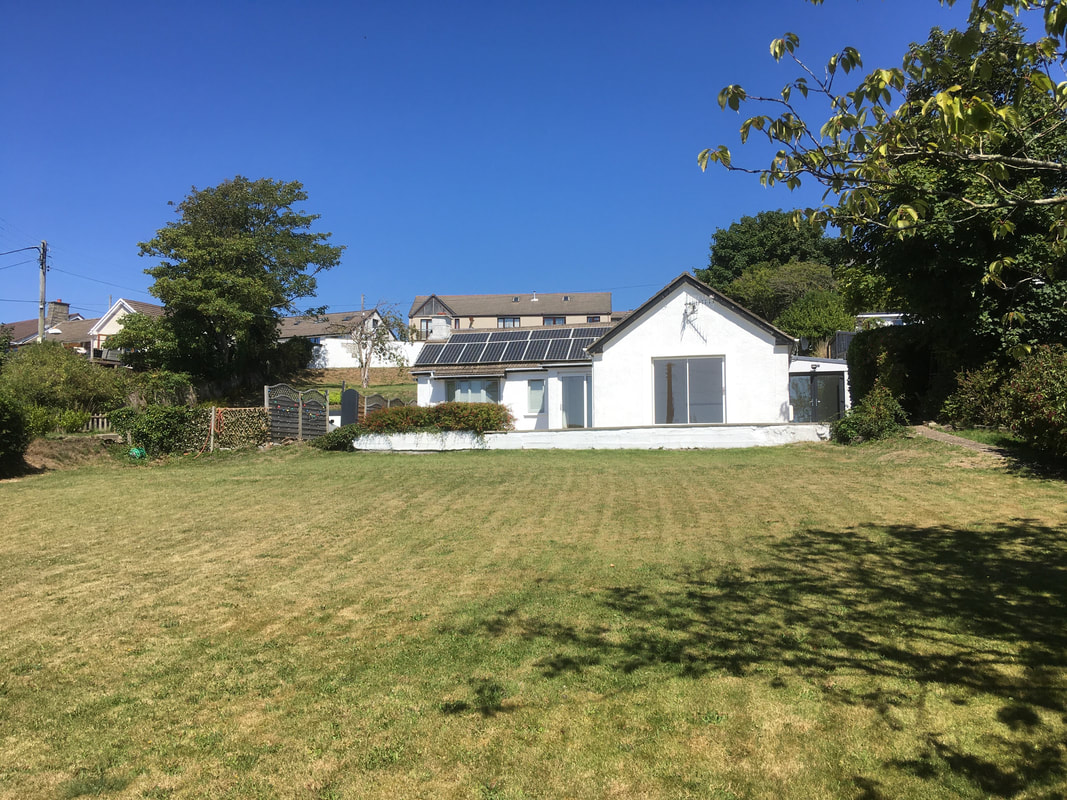
Having been notified by Octopus that my 2 year fixed tariff was coming to an end next month, it was time to try and work out what would be the best tariff to switch to for the coming winter months. The additional solar panels were working very well and together with the existing panels could produce a total output of over 40 kWh on a good day. 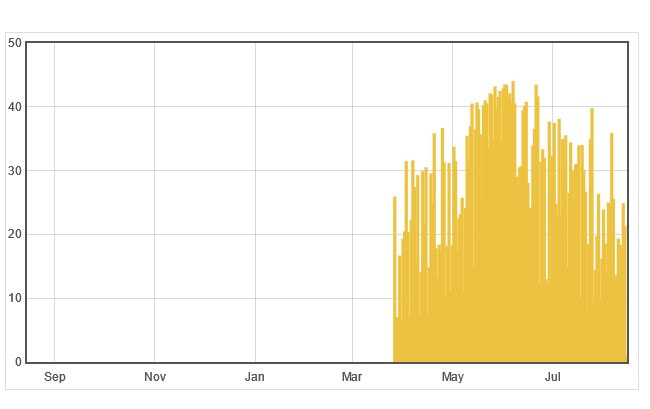 Taking into account water heating via my Eddi diverter and other electrical loads during the day, the amount exported was also looking very healthy. The 5kWh battery was easily picking up the slack in the evening, even if we had the central heating on as the COP for the heat pump in the warmer months was easily over 4. 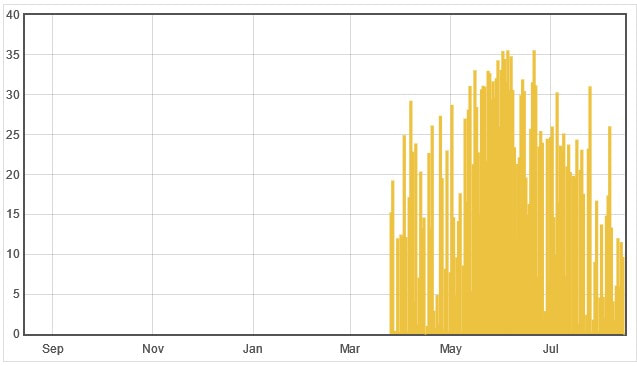 The unknown was how would this change once the days started drawing in and the temperature starting falling.
My gut feeling was that there would still be some export on reasonable days, but on very cloudy days I might need some assistance from the grid. Octopus have several tariffs that allow access to cheap rate electricity at certain times of the night (and day). It would be easy to set up my hot water cylinder to heat up during one of these periods and it should be possible to charge the battery in the same way. Some of these tariffs are restricted to EV owners but two, 'Flux' and 'Cosy' are open to anyone and look like good options so long as you can avoid using energy during their peak rate time (16:00-19:00). I didnt have to make a decision till late September, so I decided to monitor the situation and see what happened to my production and usage.
0 Comments
The Mixergy cylinder was performing well, getting topped up excess solar power from the Eddi which was receiving it from the Huawei solar panels. The only problem was that each of these systems had its own separate app/web software. In addition I was also using OpenEnergyMonitor for the rest of my home monitoring. What was needed was something where I could bring all these sources of information together into one place to give an overview of what was happening. After a bit of research I settled on some open source software called Home Assistant. The software is very flexibile and already had interfaces for Mixergy, Eddi and OpenEnergyMonitor. I had also found some information on how it might be connected to my Huawei solar system too, but that looked more difficult and would be a task for another day. After a bit of time and effort, I managed to start to get together a dashboard showing some of the most important pieces of data. This could be added to and adjusted as time went on. 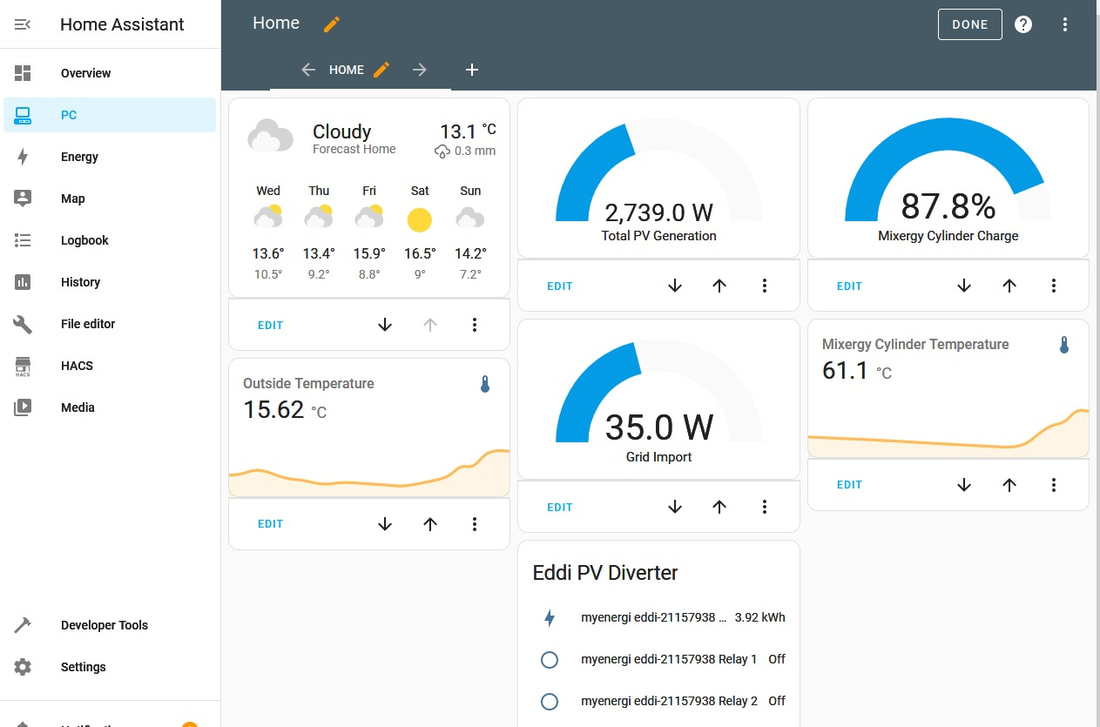 Having made some enquires online with people who know more about the issues than I, I came down on the side of replacing the pump I had bought, with a replacement that did have PWM control. In fairness I did get differing views about how useful this would be and the decision wasn't clear cut, but at least now I would be able to measure if the PWM pump was more efficient than the pump I already had. I managed to find a Grundfos UPM3 FLEX AS 25-75 130 AZA on eBay at a very good price, this would replace my Grundfos UPM3 AUTO 25-75 130. You can see how easy it is to make a mistake. :-) Another thing the learned online population managed to help me out with was sorting out the issue with my heat meter. In the end it was surprisingly easy to diagnose. 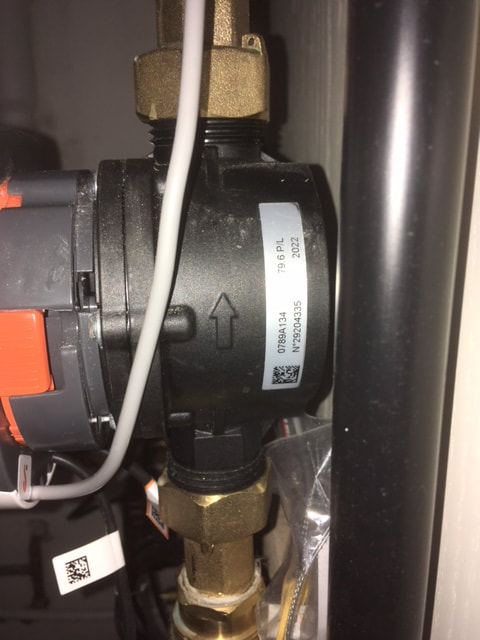 I had put the meter on upside down! While I did feel a bit of an idiot, at least it was an easy fix.
I decided to wait until my new pump arrived and then drain down the system and do both jobs at once. Having installed a Sontex 789 heat meter in my pipework, now was the time to use it to monitor how my heat pump was performing. The meter has an MBUS output and by using an MBUS to USB adaptor it could be connected to my EmonPi. 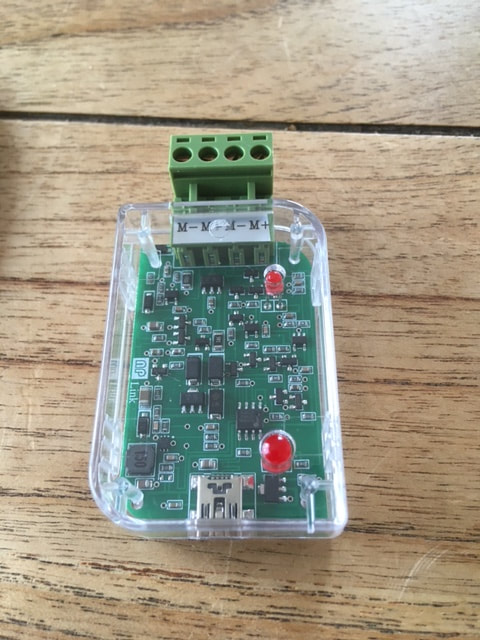 The Sontex 789 is a little fiddly to get installed on the EmonPi and it was useful to have had a bit of experience working with Raspberry Pis'. Once I had managed it though, I had my first chart of how things were going. To my surprise it indicated that my heat pump was performing very badly, but that was contrary to fact that it was heating the house using only 700W of power. After some troubleshooting it appeared that the heat meter wasn't measuring flow rate correctly and might need to be taken off and examined. For now however I just created a scaling factor based on the flow rate reported by the Samsung controller, to give a rough idea of what was going on. 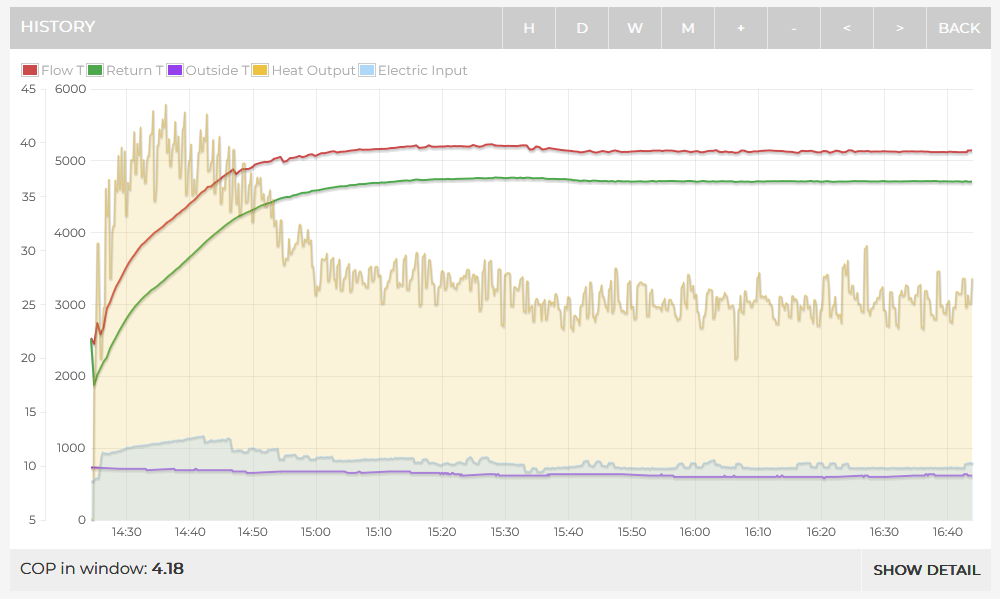 The red and green lines show the flow and return temperatures of the heat pump, showing a difference of about 3 degrees C once it reaches steady state. The orange line shows the amount of heat produced in Watts and the blue line the amount of electrical power in Watts needed to create it. Dividing the Heat output by the electrical input gives the Coefficient of Performance (COP) of the heat pump at that moment. The purple line at the bottom shows the temperature outside.
My graph shows that with a flow temperature of about 39 C, my COP is about 4. In other words its about 400% efficient when the temperature outside is 9 C This might sound crazy, but its possible because the heat pump isnt using electricity to create heat like an electric heater does. Its using the electricity to move heat, from the outside to the inside of your house. As a preliminary figure, I was very happy with this and it would indicate that if I ran the heating all day at this outdoor temperature my electricity use would be about 24 hours x 0.7 kW = 16.8 kWh. In reality I might not run it all day and some or all of the electrical energy would come from my solar panels. The heat pump worked perfectly after starting it up and all the rooms became lovely and warm. It was a sunny day and the 5 kWh battery was full so the heating was on till 11pm and cost nothing to run :-) I decided to turn the heating off when we went to bed. There is an argument that a heat pump should be left on 24/7 for maximum efficiency, but I knew my battery would be totally drained shortly and even if the heat pump was less efficient while starting up in the morning, I would likely have free solar to cover it. I woke at 6am in need of the toilet and to my horror saw an error message on the heat pump controller. Once I was awake I looked it up, E912 a flow switch error. Luckily there was a forum entry on buildhub.org (https://forum.buildhub.org.uk/topic/25596-samsung-gen-6-ashp-e912-flow-switch-off-and-water-pump-on-error-e912/). The error can be caused by a sticky relay on the control board that causes the pump to stay on even when there is no call for hot water. Lo and Behold my pump was on continually. Something else to contact the heat pump supplier about on Monday! 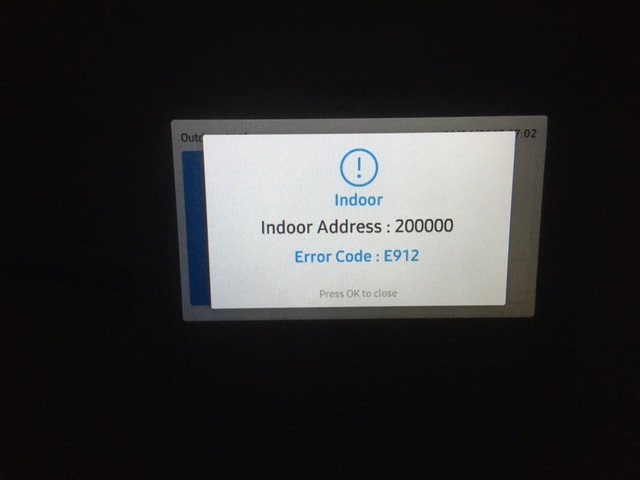 I added some CT clamps to monitor the electricity through the heat pumps outdoor and indoor units to gain some insight into how much it was going to cost the run. The OpenEnergyMonitor system didn't let me down. 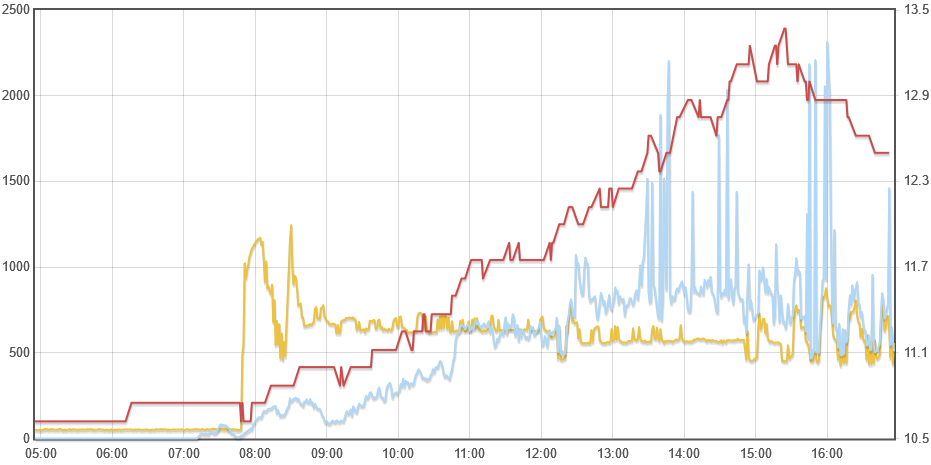 This graph shows my solar output in blue, the heat pumps power usage in orange and the outside temperature in red. Sadly it was a very dull day.
Once I had set up the OpenEnergyMonitor system, I could start to get some interesting data from the solar panels. 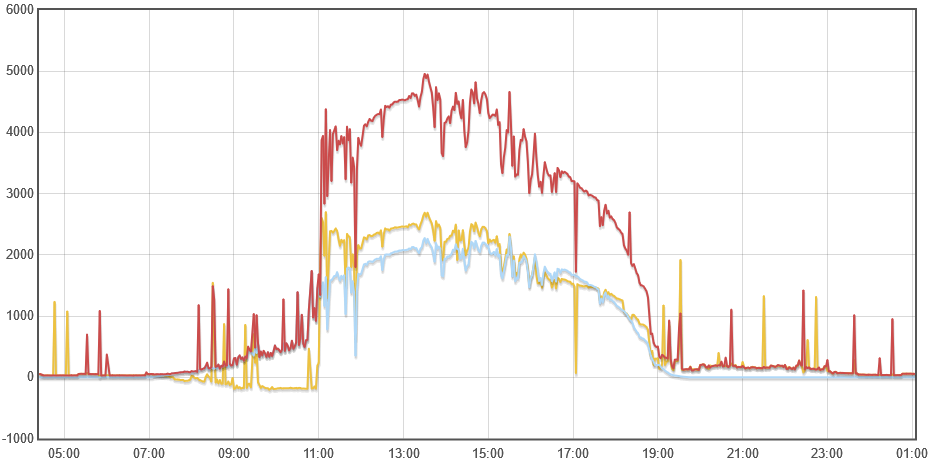 In the above chart, the blue line shows the output from my existing 2.66 kWp array and the orange line the output from the new 4.62 kWp array. Note that the orange line goes negative at the start of the day. This is when the array is charging its DC coupled battery. The red line shows the combined output of both arrays. On this sunny April day, the maximum output touches 5kW. 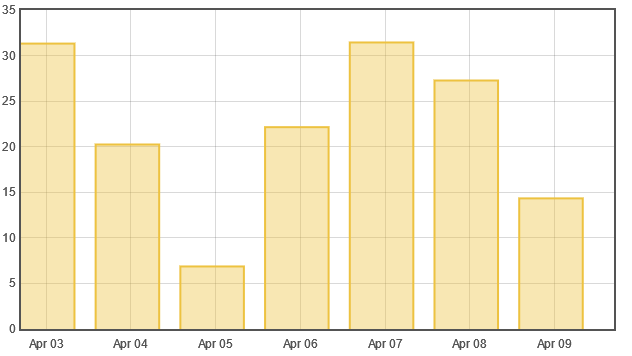 This chart shows the total number of kWhs produced each day.
As I now had a second array of solar panels, I needed to upgrade my monitoring system. I purchased an EmonTx V4 which gave me the ability to monitor more electricity flows and also outside temperature. this would be important when I came to see how well my heat pump was performing. 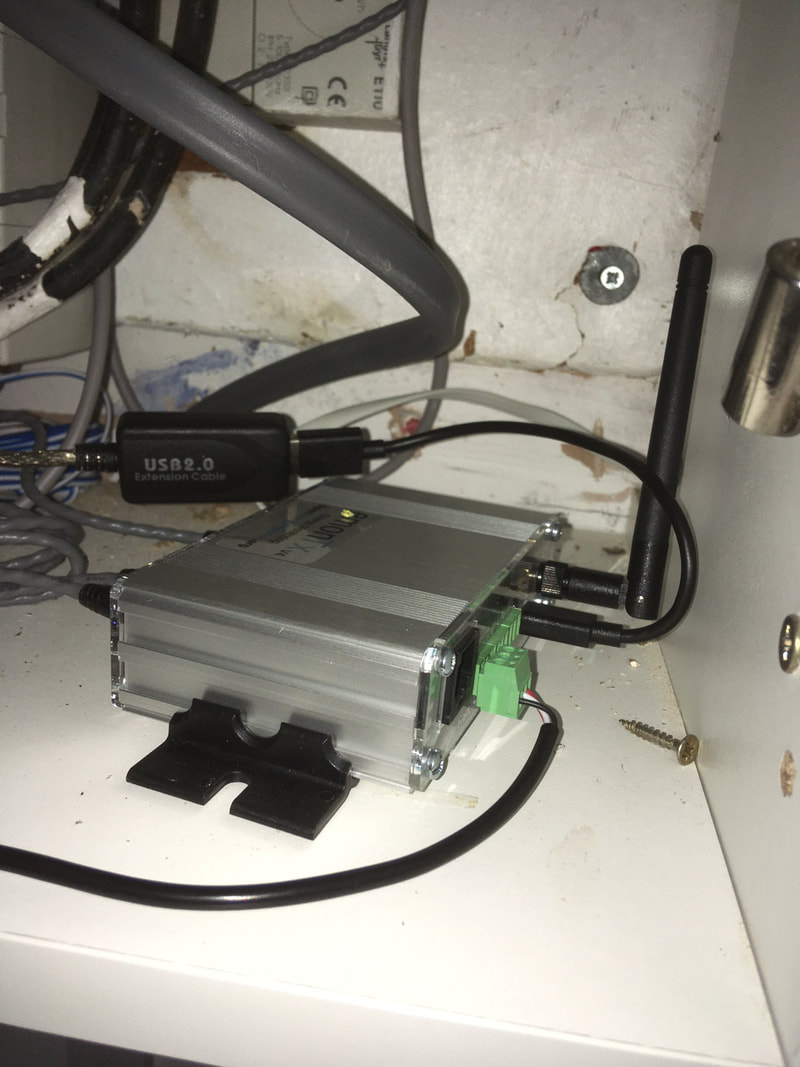 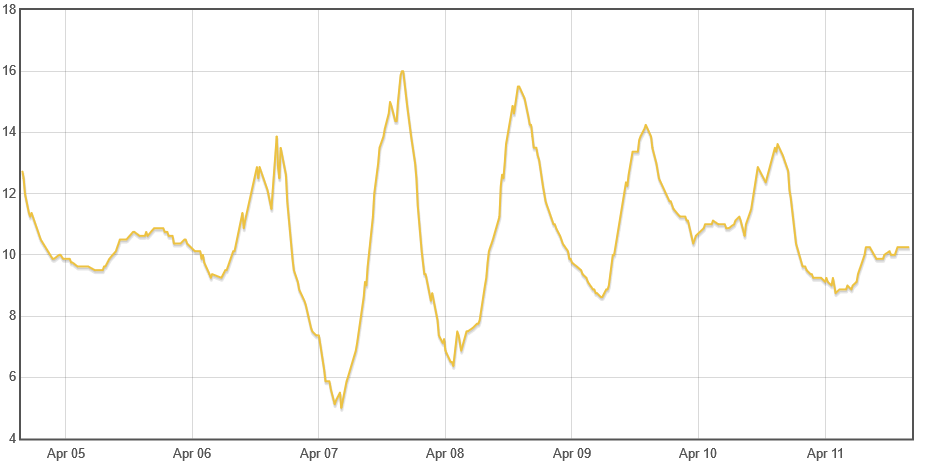 An important part of knowing what choices to make for the future is knowing what is happening now. In my old house I really found it frustrating that even though I knew what my solar panels were producing, I couldn't find out how much energy I was importing or exporting or where my energy was being used. I decided not to make the same mistake again and chose to invest in a monitoring system. Reading around, the obvious choice seemed to be the system made by Openenergymonitor.org and in hindsight it was a very good choice. I am able to monitor and graph how much energy I am producing from my solar panels, importing from the grid or exporting to the grid, and thats just the start. I intend to have more solar panels fitted and the system can easily be expanded to include those too as well as monitoring a myriad of of variables such a temperature and heat pump efficiency in the future. 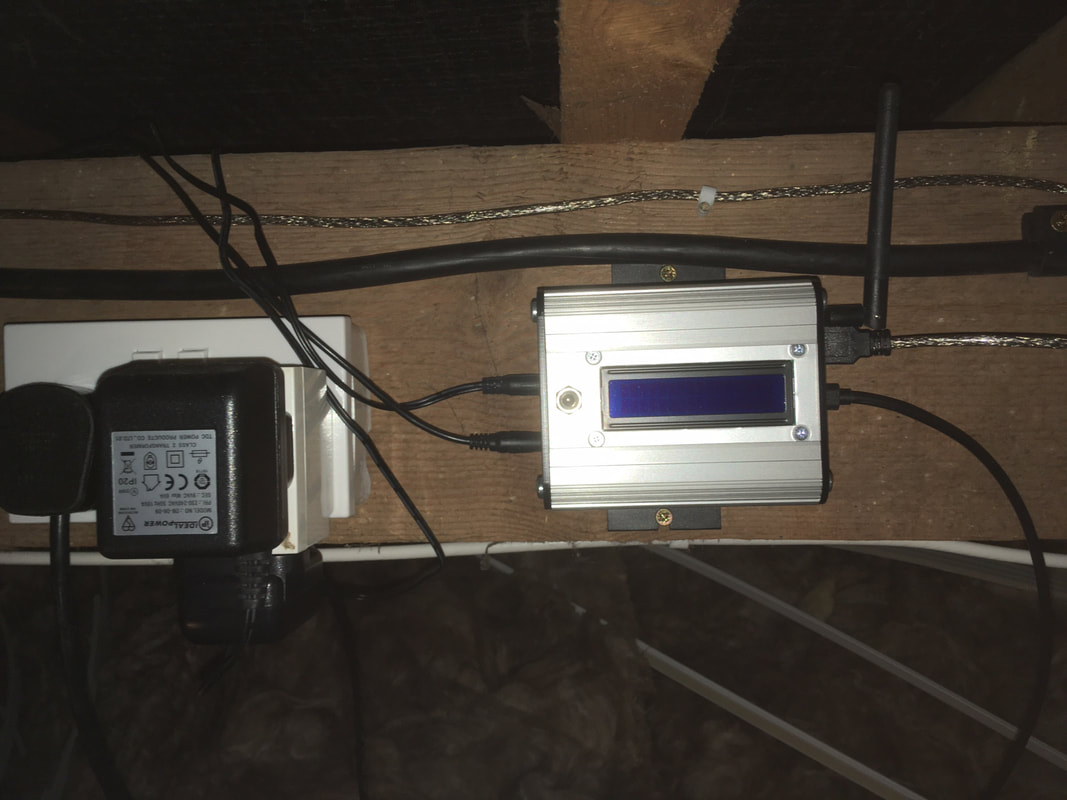 |
AuthorEx Radiographer, Information Analyst, Teacher and Self-builder. Now retired Archives
December 2023
Categories
All
|
 RSS Feed
